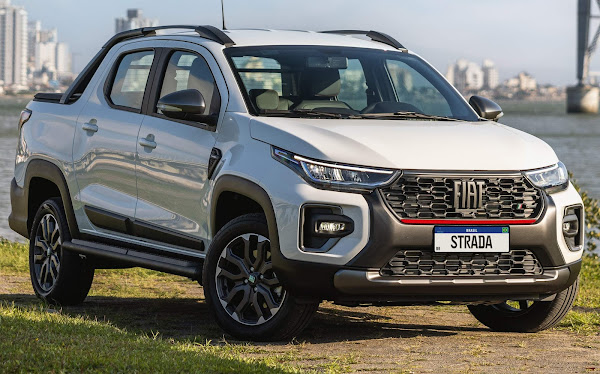
Em agosto de 2023, 94.025 carros e comerciais leves foram emplacados no mercado brasileiro, de acordo com os dados coletados até o dia 17, sendo eles:
|
#
|
Marca
|
Agosto | Acumulado |
λ Ag/Jl
|
||
| Vendas | M Share | Vendas (Y) | Share(Y) | |||
| 1 | FIAT | 22.168 | 23,6% | 273.449 | 22,01% | -11,7% |
| 2 | VW | 13.022 | 13,8% | 192.929 | 15,53% | -45% |
| 3 | GM | 12.979 | 13,8% | 191.469 | 15,41% | -23% |
| 4 | Toyota | 9.381 | 10,0% | 114.773 | 9,24% | -4% |
| 5 | Hyundai | 7.794 | 8,3% | 103.676 | 8,35% | -38% |
| 6 | Jeep | 5.862 | 6,2% | 80.938 | 6,51% | -11% |
| 7 | Renault | 4.893 | 5,2% | 71.873 | 5,79% | -38% |
| 8 | Honda | 3.620 | 3,9% | 44.442 | 3,58% | -5% |
| 9 | Nissan | 3.175 | 3,4% | 41.668 | 3,35% | -18% |
| 10 | Peugeot | 1.768 | 1,9% | 19.715 | 1,59% | -19% |
| 11 | CAOA Chery | 1.677 | 1,8% | 15.030 | 1,21% | 8% |
| 12 | Citroen | 1.409 | 1,5% | 18.986 | 1,53% | -25% |
| 13 | Ford | 1.283 | 1,4% | 15.393 | 1,24% | 17% |
| 14 | Mitsubishi | 755 | 0,8% | 9.723 | 0,78% | -8% |
| 15 | BMW | 685 | 0,7% | 8.156 | 0,66% | 3% |
| 16 | BYD | 569 | 0,6% | 2.812 | 0,23% | 85% |
| 17 | GWM | 532 | 0,6% | 3.647 | 0,29% | -1% |
| 18 | RAM | 481 | 0,5% | 5.850 | 0,47% | 16% |
| 19 | Volvo | 386 | 0,4% | 4.985 | 0,40% | 11% |
| 20 | Mercedes | 276 | 0,3% | 3.630 | 0,29% | 19% |
| 21 | Land Rover | 228 | 0,2% | 2.954 | 0,24% | -12% |
| 22 | Porsche | 219 | 0,2% | 3.276 | 0,26% | -4% |
| 23 | Kia | 188 | 0,2% | 2.934 | 0,24% | -17% |
| 24 | Audi | 178 | 0,2% | 3.493 | 0,28% | -35% |
| 25 | Iveco | 108 | 0,1% | 1.380 | 0,11% | -14% |
| 26 | EFFA | 85 | 0,1% | 805 | 0,06% | 213% |
| 27 | VW-MAN | 79 | 0,1% | 1.145 | 0,09% | 1% |
| 28 | Mini | 57 | 0,1% | 892 | 0,07% | -29% |
| 29 | Lexus | 52 | 0,1% | 425 | 0,03% | 7% |
| 30 | Suzuki | 49 | 0,1% | 688 | 0,06% | 11% |
| 31 | JAC | 21 | 0,0% | 402 | 0,03% | -27% |
| 32 | RDK | 17 | 0,0% | 166 | 0,01% | 25% |
| 33 | Jaguar | 13 | 0,0% | 240 | 0,02% | -26% |
